PACE Website
Main menu:
Data Input/Output
Animation Show > PACE Technology
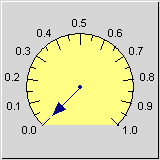
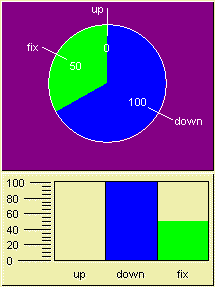
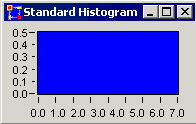
PACE comes with an extensive library of graphic elements to visualize results and parameters or to adjust process parameters. These include:
- Windows for individual curves, including manual curve input, e.g., for inputting estimates and trends
- Bar charts
- Histograms
- Presentation diagrams (e.g., pie charts)
- Sliders
- Data wheels
- Indicating instruments
- Tables
- Button boards
Sub-Menu: